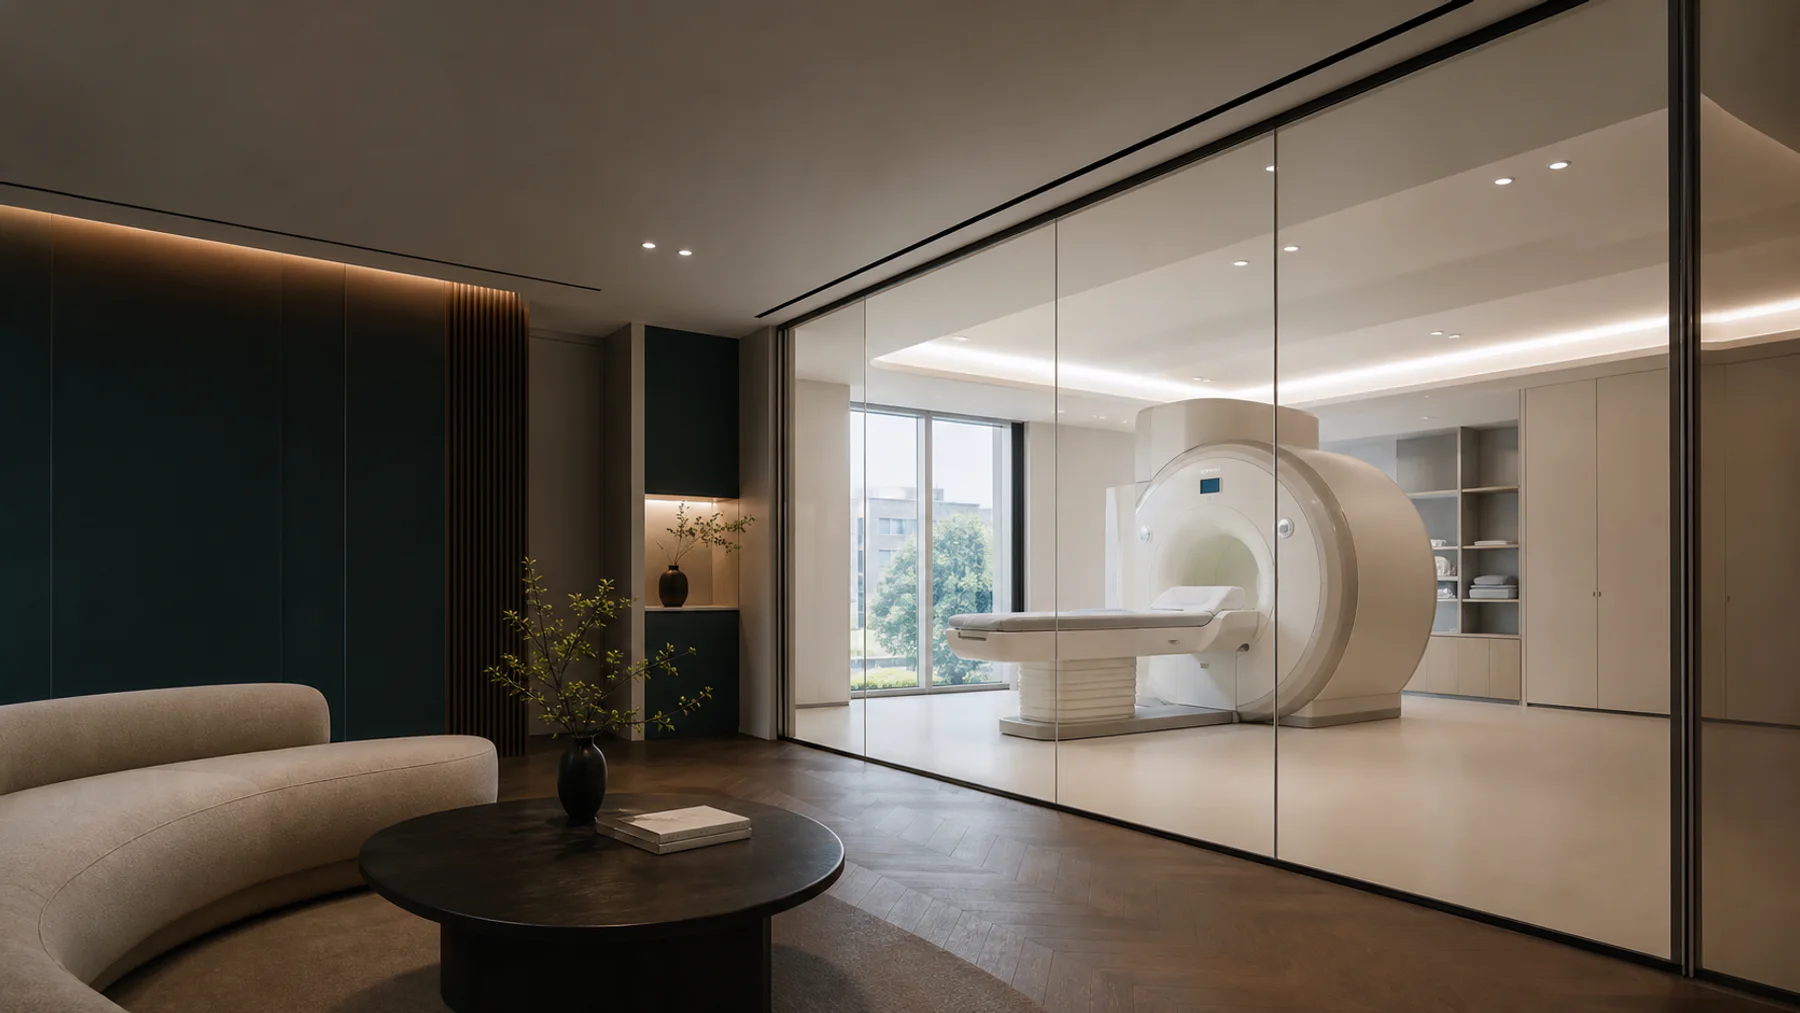
Korea has 38.66 MRI units per million people, third among OECD countries and about twice the OECD37 average of 19.72. It also has 12.6 hospital beds per 1,000 people against an OECD average of 4.2, which is the most of any member country. Those figures are real, they are published by the OECD, and they are the reason a scan that takes weeks to schedule elsewhere can often be arranged in Korea within days.
They do not mean the scan is better. The OECD says so in the same report, and this article carries that sentence because leaving it out is how a capacity statistic turns into a marketing claim.
The numbers, and where they actually live
One thing to get out of the way first, because it affects whether you can check any of this. The Korea country note for Health at a Glance 2025 does not contain a standalone MRI figure. It reports the three imaging technologies together: 87 CT scanners, MRI units and PET scanners per million people, against an OECD average of 51. The separate MRI count exists only in the dataset published behind Figure 9.10 of the full report. Anyone quoting “38.7 MRI units per million, from the OECD Korea country note” is citing a document that does not have the number in it.
Here is what that dataset says, on 2023 or nearest-year figures:
| Rank | Country | MRI units per million |
|---|---|---|
| 1 | Japan | 59.81 |
| 2 | Greece | 39.11 |
| 3 | Korea | 38.66 |
| 4 | United States | 37.98 |
| 5 | Germany | 35.30 |
| — | OECD37 average | 19.72 |
Third, not second. Greece sits between Japan and Korea, which is easy to miss because Greece is not who anyone expects to find there. Korea does come second on a strictly-2024 cut of the data, but only because Japan reports triennially and filed no 2024 figure. That is a reporting artefact rather than an overtaking, so third is the rank worth citing.
What the OECD refuses to conclude
This is the part that usually gets dropped. From the same publication, verbatim:
There is no general guideline or international benchmark regarding the ideal numbers of CT scanners, PET scanners or MRI units. Too few units may lead to access problems in terms of geographic proximity or waiting times, while too many may result in overuse of these costly diagnostic procedures, with little if any benefit for patients.
The body that publishes the equipment-density table declines to treat a higher number as better. It names a cost on both sides. An 87-against-51 figure presented as evidence of superior care is going further than the source it rests on, and the source says so in advance.
So what does the number support? Access. If a country has roughly twice the OECD average of MRI units, the scan is easier to get. That is a claim about calendars, not about radiology, and calendars are the honest version of the argument for travelling to Korea for a scan.
The claim that is simply wrong
There is a figure circulating that Korea ranks first globally for MRI scans performed per person. It does not.
On MRI exams per capita, Korea ranks 16th of 31 OECD countries reporting, slightly below the OECD average. The likely origin of the error is real and adjacent: Korea is first in the OECD on CT exams per capita, and second on all three imaging technologies combined. Somewhere between those and MRI, the modality changed and the ranking travelled with it.
One caveat runs the other way, and it is substantial. Korea’s OECD utilisation figures exclude privately funded exams. Self-pay comprehensive screening is exactly the market this site sells into, so a large share of Korea’s actual MRI volume is not in the number at all. Korea’s true per-person imaging volume is higher than the OECD reports by an amount nobody here has measured. That means the published utilisation rank understates Korea, and it also means this site cannot lean on utilisation rankings in either direction without saying this out loud.
What this changes about planning a trip
Three practical consequences, in descending order of how much they should affect a decision.
Scheduling is the real advantage, and it is a capacity story. Days to be seen and scanned rather than weeks or months on a waiting list is what a high unit count buys. It is also the claim that survives every caveat above. Where this site once reached for report turnaround as the differentiator, the sourced figures killed that argument. The written report takes two to three weeks depending on the centre, and of the three whose turnaround was read, one publishes no figure at all.
Volume is a reasonable proxy for practice, and a weak one for outcome. A high-throughput endoscopy suite is staffed and equipped for the procedure you are having, and the person reading your images does it all day. That is a genuine argument. It is not the same argument as a better result, and the OECD’s own warning about overuse cuts directly against stretching it that far.
Beds are not scanners. Korea’s 12.6 hospital beds per 1,000 is first in the OECD and has almost nothing to do with a screening visit, where you arrive in the morning and leave in the afternoon. It is a real figure, just not one that speaks to a screening visit.
How to check any of this
Every figure above comes from the OECD, and the OECD publishes the underlying spreadsheets. The country note is a six-page PDF. The MRI-unit dataset is one file behind Figure 9.10, dated 13 November 2025. Note that the HTML landing page for the Korea note returns an error to a plain fetch while the PDF does not, which is why the citation under this article points at the PDF.
One thing worth knowing before you go looking. Two different OECD-derived averages for MRI units are in circulation, 19.72 and 21.2, and both are correct. They come from two different OECD publications: 19.72 from Health at a Glance 2025, the report released in November, and 21.2 from OECD Health Statistics 2025, the database released in July, as analysed by Korea’s Ministry of Health and Welfare. The CT averages diverge the same way, 28.83 against 31.1, which is what tells you these are different vintages rather than one of them being a typo. Korea’s own figure barely moves between them, 38.66 and 38.7.
So the rule is to name the document rather than attributing a figure to “the OECD” generically. This article uses 19.72 throughout because it comes from the same table as Korea’s 38.66. Taking a country figure from one publication and an average from the other is how these numbers quietly drift, and it leaves no visible trace when it happens.